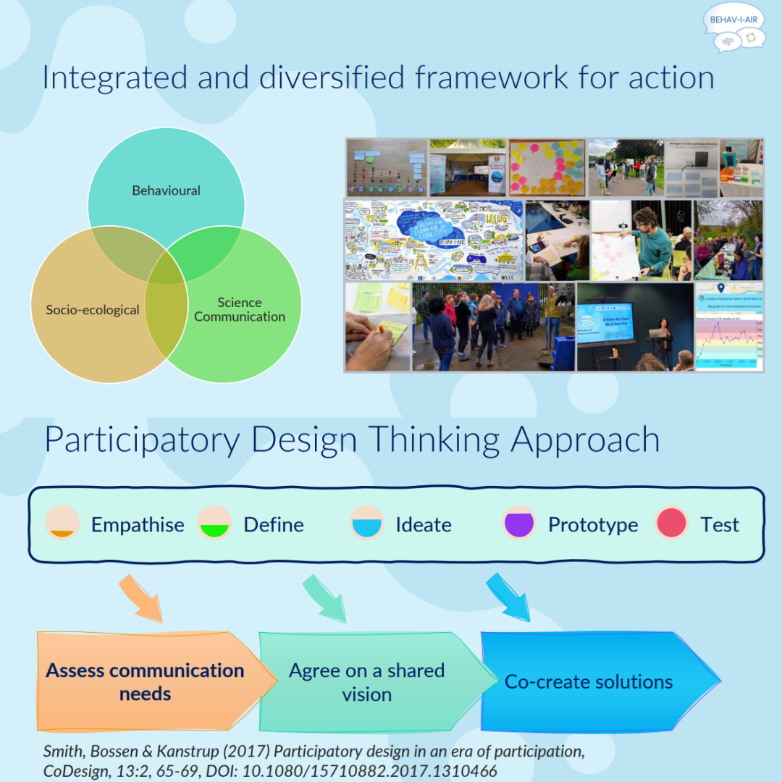
BEHAV-I-AIR research activities are informed by a design thinking approach to social innovation.
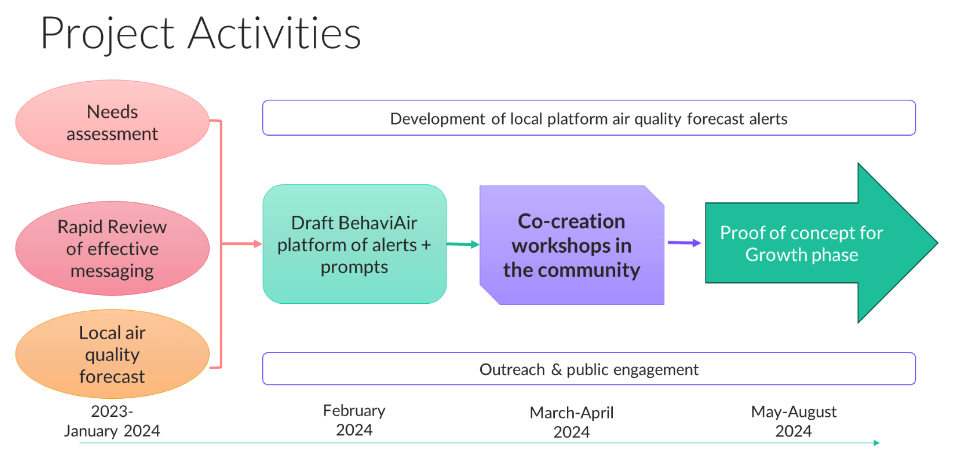
To date, we have been working on the following activities:
- Carry out a needs assessment for air quality communication among key stakeholders and prioritise the most important needs.
- Map the available international evidence on air quality-related communication interventions and their effectiveness for promoting awareness and behavioural change. We identified and analysed over 70 studies. A paper is currently under review with an international journal.
- Develop a model of forecasts of air quality using the local sensors in Cork City.
- Hold Co-Creation Workshops in the Community to co-create a platform of air quality forecast alerts with targeted behavioural messages.
- Disseminate our work at conferences and invited talks
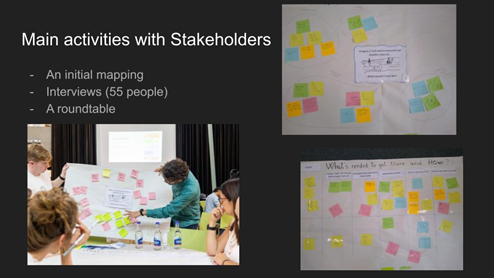
Needs Assessment and Prioritisation

To date, we have talked to over 60 stakeholders via individual interviews and a public roundtable held on Clean Air Day on the 7th September 2023. A beautiful graphic summary of the roundtable, which was title “A vision for Clean Air in Cork City, is depicted in the below illustration by local artist Robyn Deasy.
We have been listening to individuals with health vulnerabilities, health promotion officers, community organisations, educators, policymakers both locally in Cork, nationally and internationally.
Through analysis of these conversations, we have identified 28 needs. These relate on one hand to how air quality is communicated, and to how people want to be able to understand the risks of air pollution in an accessible and timely manner, and how they want to be empowered to be part of the solution for clean air either through their individual behaviour or by elevating the issue through civic engagement. On the other hand, there are key systemic constraints that are beyond the control of the individual, and thus there are needs related to having supportive infrastructure and policies that really empower people to contribute to clean air.
A complete map of the needs emerged and can be found below and also accessed here
From this mapping exercise, we have generated a series of needs statements that we have used to identify priorities for air quality communication. A full list of need statements can be accessed here
A report with a full analysis of needs priorities is in preparation.

Forecasting
A core element of the BEHAVI-AIR project is forecasting of air pollutant levels. Knowing when air pollution will be excessive is vital so that people can plan their time and activities to avoid breathing dirty air, and to know when it’s especially important to refrain from polluting activities.
What air pollutants are we studying and why should you care about them?
We are focussing on two key air pollutants — nitrogen dioxide (NO2) and fine particulate matter (PM2.5). NO2 is strongly associated with vehicle emissions, particularly from diesel vehicles, while PM2.5 in Ireland mostly comes from burning solid fuels for domestic heating. Both are terrible for our health, causing heart disease, strokes, cancer, and respiratory diseases like asthma. In Ireland, about 1,300 people die every year from these air pollutants.
Can air pollution really be forecast?
Yes! Most air pollution in Ireland is produced by human activities like domestic heating and driving vehicles, while weather patterns affect transport and dispersion of pollutants in the air. Human activities are mostly determined by time of the day, day of the week, and season, while wind speed and wind direction influence where air pollution is coming from and how quickly it is dispersed. We apply machine learning models to air pollutant observations and meteorological data to learn how air pollution varies with time and weather conditions. We can then supply these models with weather forecasts to predict air pollution a few days into the future.
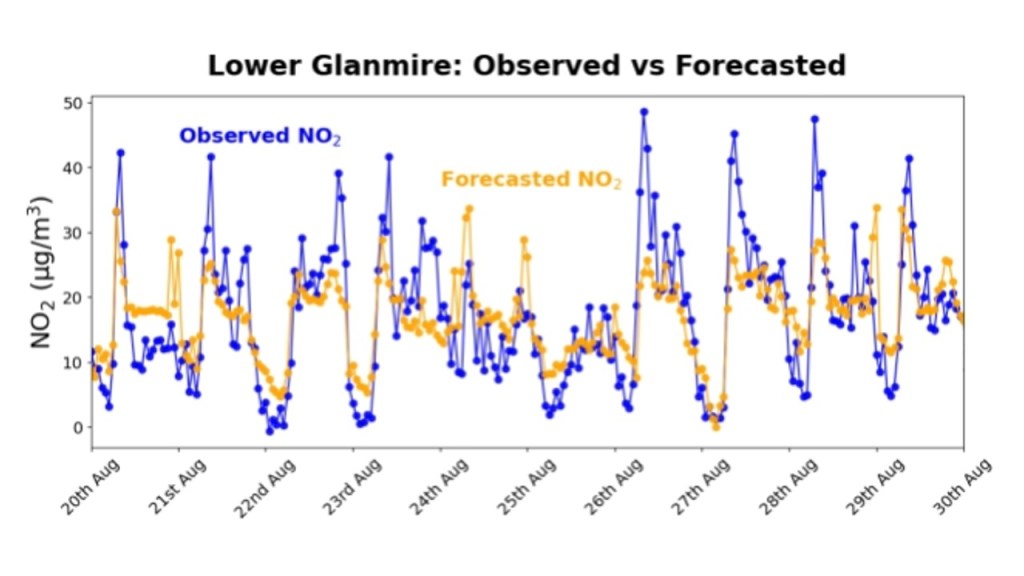
Are our forecasts any good?
Our first step is to test this approach using air quality data from various air quality monitoring sites around Cork city. So far, results are encouraging — we get good levels of agreement between predictions and observations for both NO2 and PM2.5 at several sites around the city. Predicted levels of these pollutants follow the same daily and weekly trends as we see in measurements from air quality monitoring stations in the city, giving us confidence that the approach is useful.
Understanding pollution in the city
We are also exploring how pollution varies at different sites and with changes in behaviour. For example, we observed big and sudden drops in the traffic pollutant NO2 at several air quality monitors in the city centre during Car-Free Day (23 September 2023). This analysis of air pollution shows that air pollution can be reduced, and that interventions and messages that change behaviour can help create cleaner and healthier communities. That benefits everyone.
As our project progresses, our mission remains clear: to deepen our understanding of air quality dynamics and contribute to the promotion of a healthier environment for everyone.
Dissemination Activities
Out team have been disseminating our work at conferences and invited talks. Read below for more details on the topics and conferences we have been invited to so far!
- Marica Cassarino: Enhancing public communication of air quality-related behaviours from the bottom up: Results from a design thinking-informed mapping of stakeholders’ information needs in Ireland
- Conference Information and Date: APA Division 34 Virtual conference “Psychology for a Resilient Future: Adaptation, Mitigation, and Coping in a Changing World”, 26-27 Sep 2024, online
- Short Description of Topic: The presentation described the participatory design thinking approach used in the BehaviAir project to co-create communication strategies for air quality awareness and behaviour change.
- Dean Venables: “Measurement, societal impact, & communication: An appreciation of a mid-career sabbatical in TROPOS”
- Conference Information and Date: Americal Chemical Society Fall 2024 Conference, 18-22th August 2024, Denver, Colorado
- Roberto Cibin: BEHAV-I-AIR project and its co-creation methodology
- Conference Information and Date: Sociology of innovation course, Bachelor Degree Programme in Political and Administrative Sciences, University of Trieste, 15th of May 2024
- Short Description of Topic: The presentation focused on describing to the students some cases of practical application within the BEHAV-I-AIR project of tools and techniques from participatory design and design thinking.
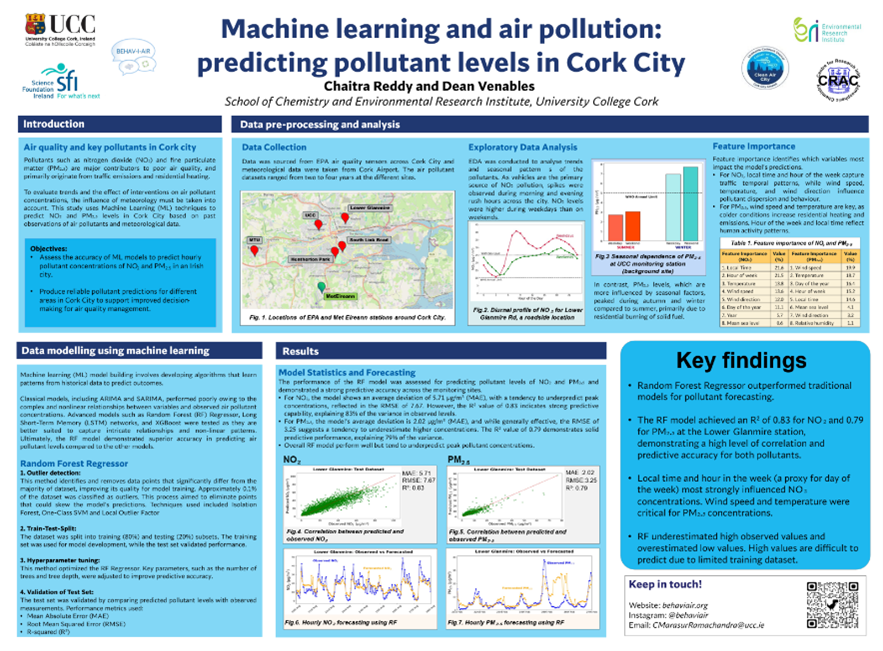
- Chaitra Reddy: Machine Learning and Air Pollution: predicting pollutant levels in Cork City
- Conference Information and Date: Clean Air Research Conference, Department of Environment, Climate and Communications, 10th October 2024, Dublin
- Short Description of Topic: This study applies Machine Learning (ML) techniques to forecast NO₂ and PM₂.₅ concentrations in Cork City by utilizing historical data on air quality and meteorological conditions. The goal is to generate accurate pollutant predictions across different areas, supporting better decision-making in air quality management.